
Town centres are facing a greater number of challenges than ever before, from out of town shopping, parking costs, occupancy costs and the continuing growth of online behaviour. The combination of these factors makes it ever more important to identify whether the changes in a towns performance are the result of local trends and/or initiatives, to whether they are due to wider regional or national rends to which all towns and cities are subject to.
Monthly Performance Report – March 2024
Notes:
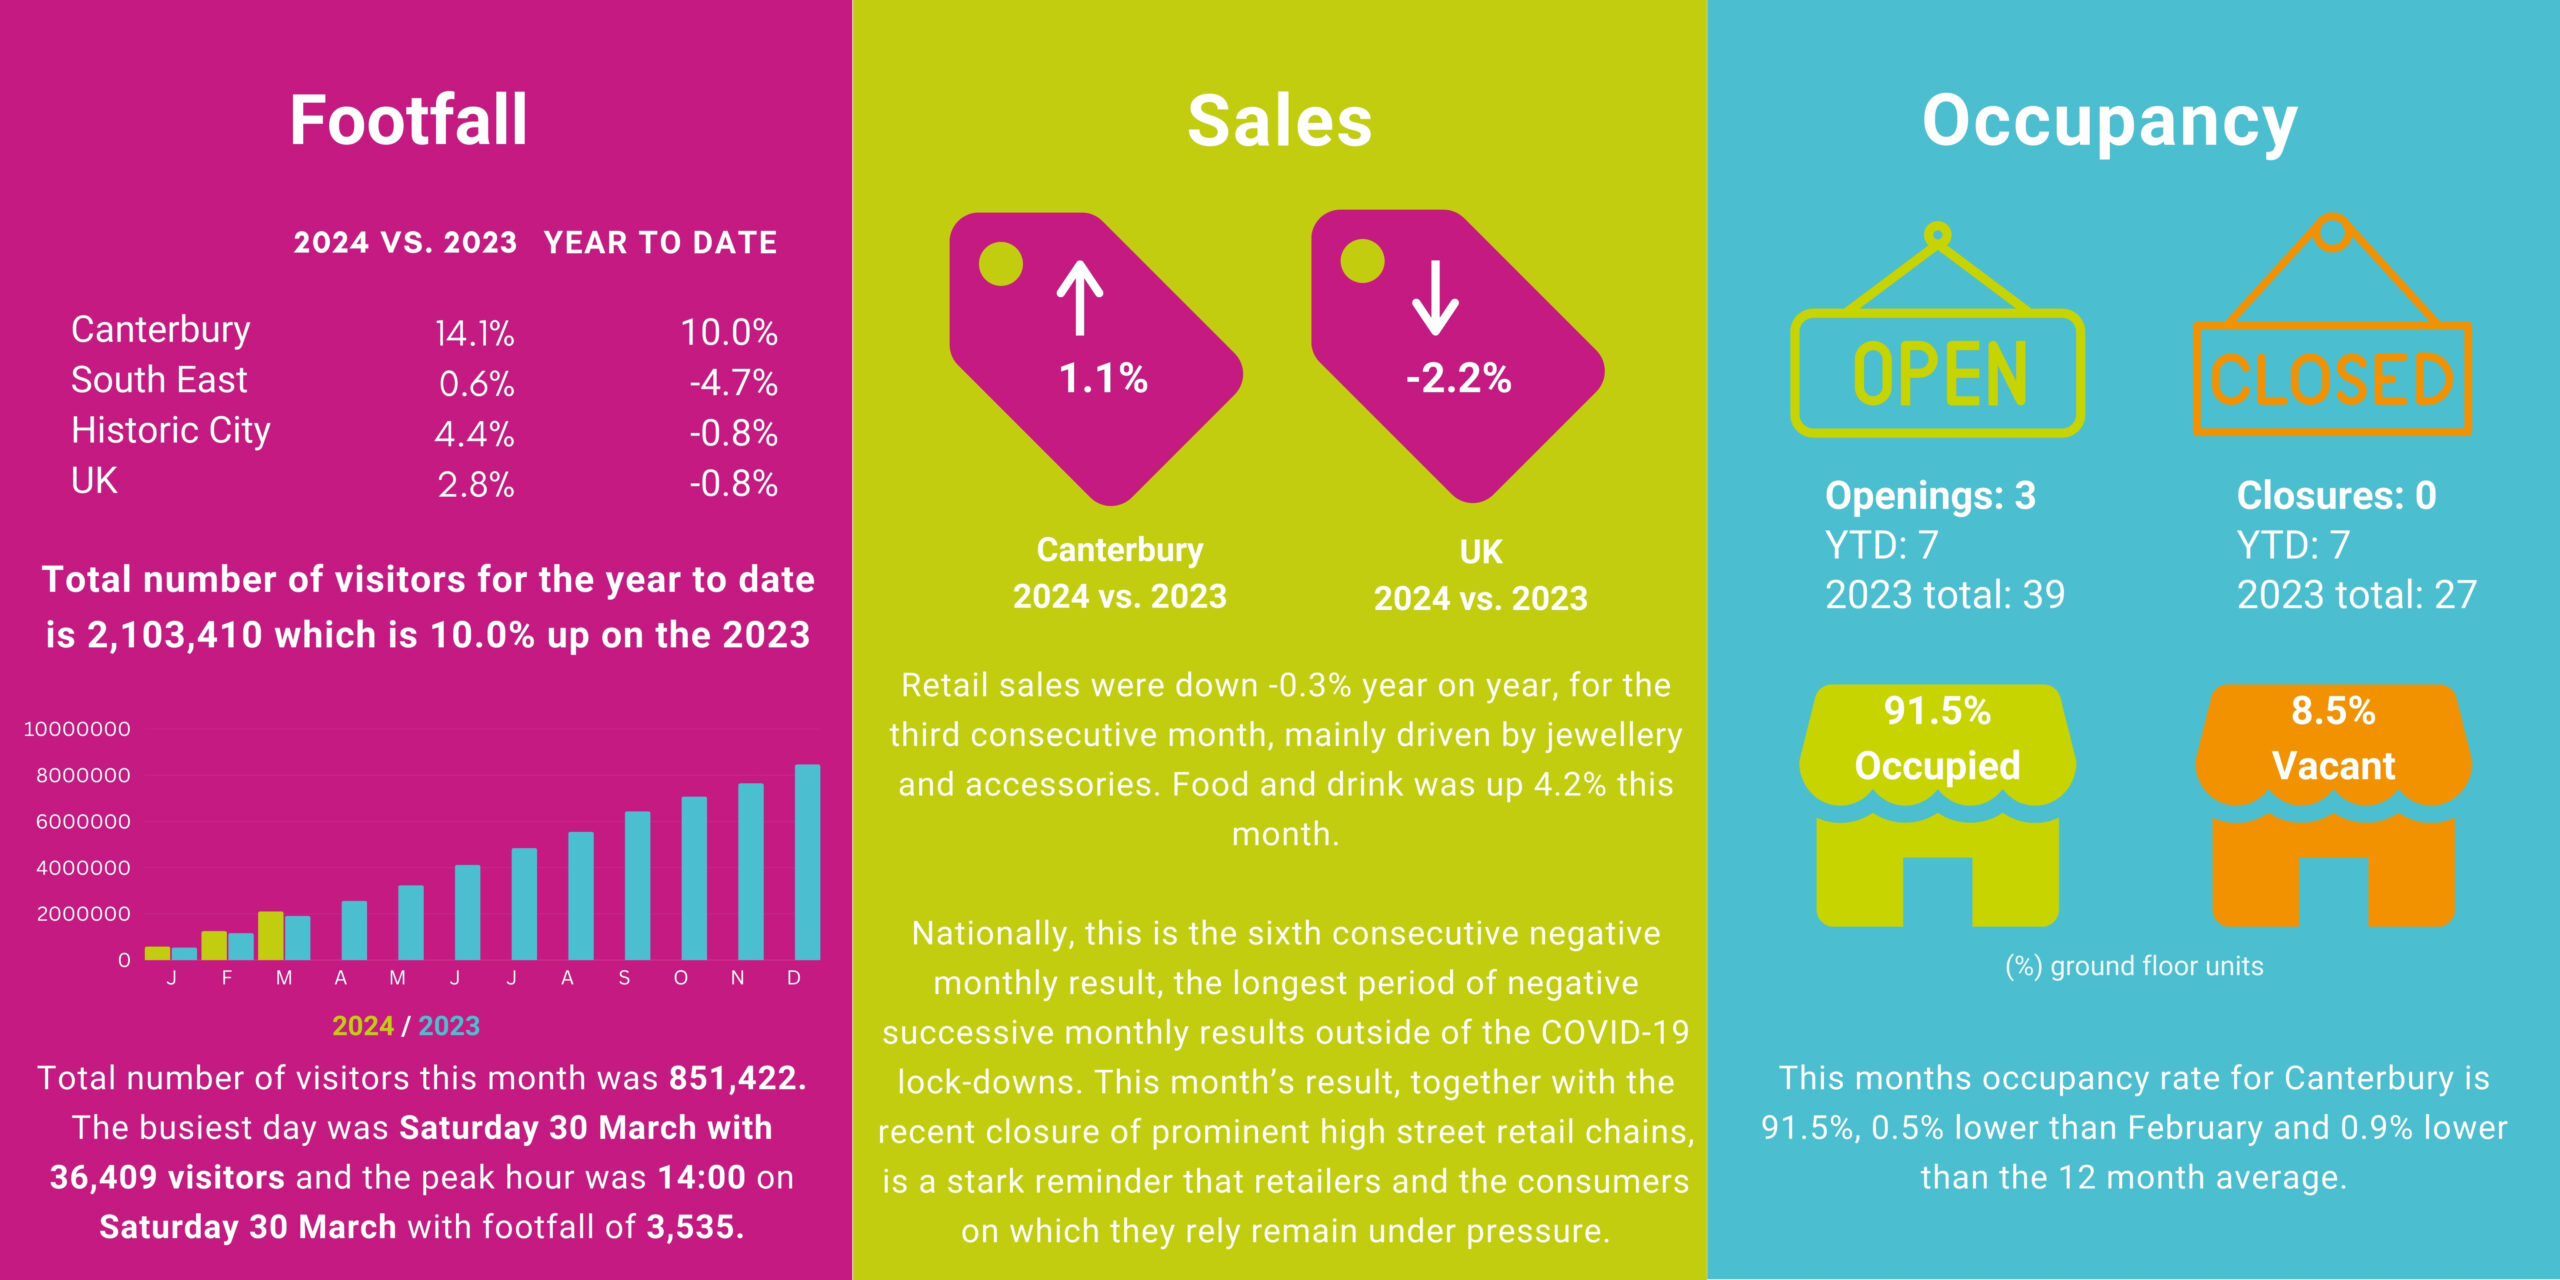
YoY – Year on Year (YoY) is the % change for the month compared to the same month the previous year. All data sets are compared YoY apart from the vacancy rate.
Sales – Data is collected monthly from businesses and annonymised so we can identify trends over time. The data is compared to the BDO Sales Monitor which provides a national perspective on the data.
Vacancy Rates – Data is collected monthly and captures groundfloor units only.
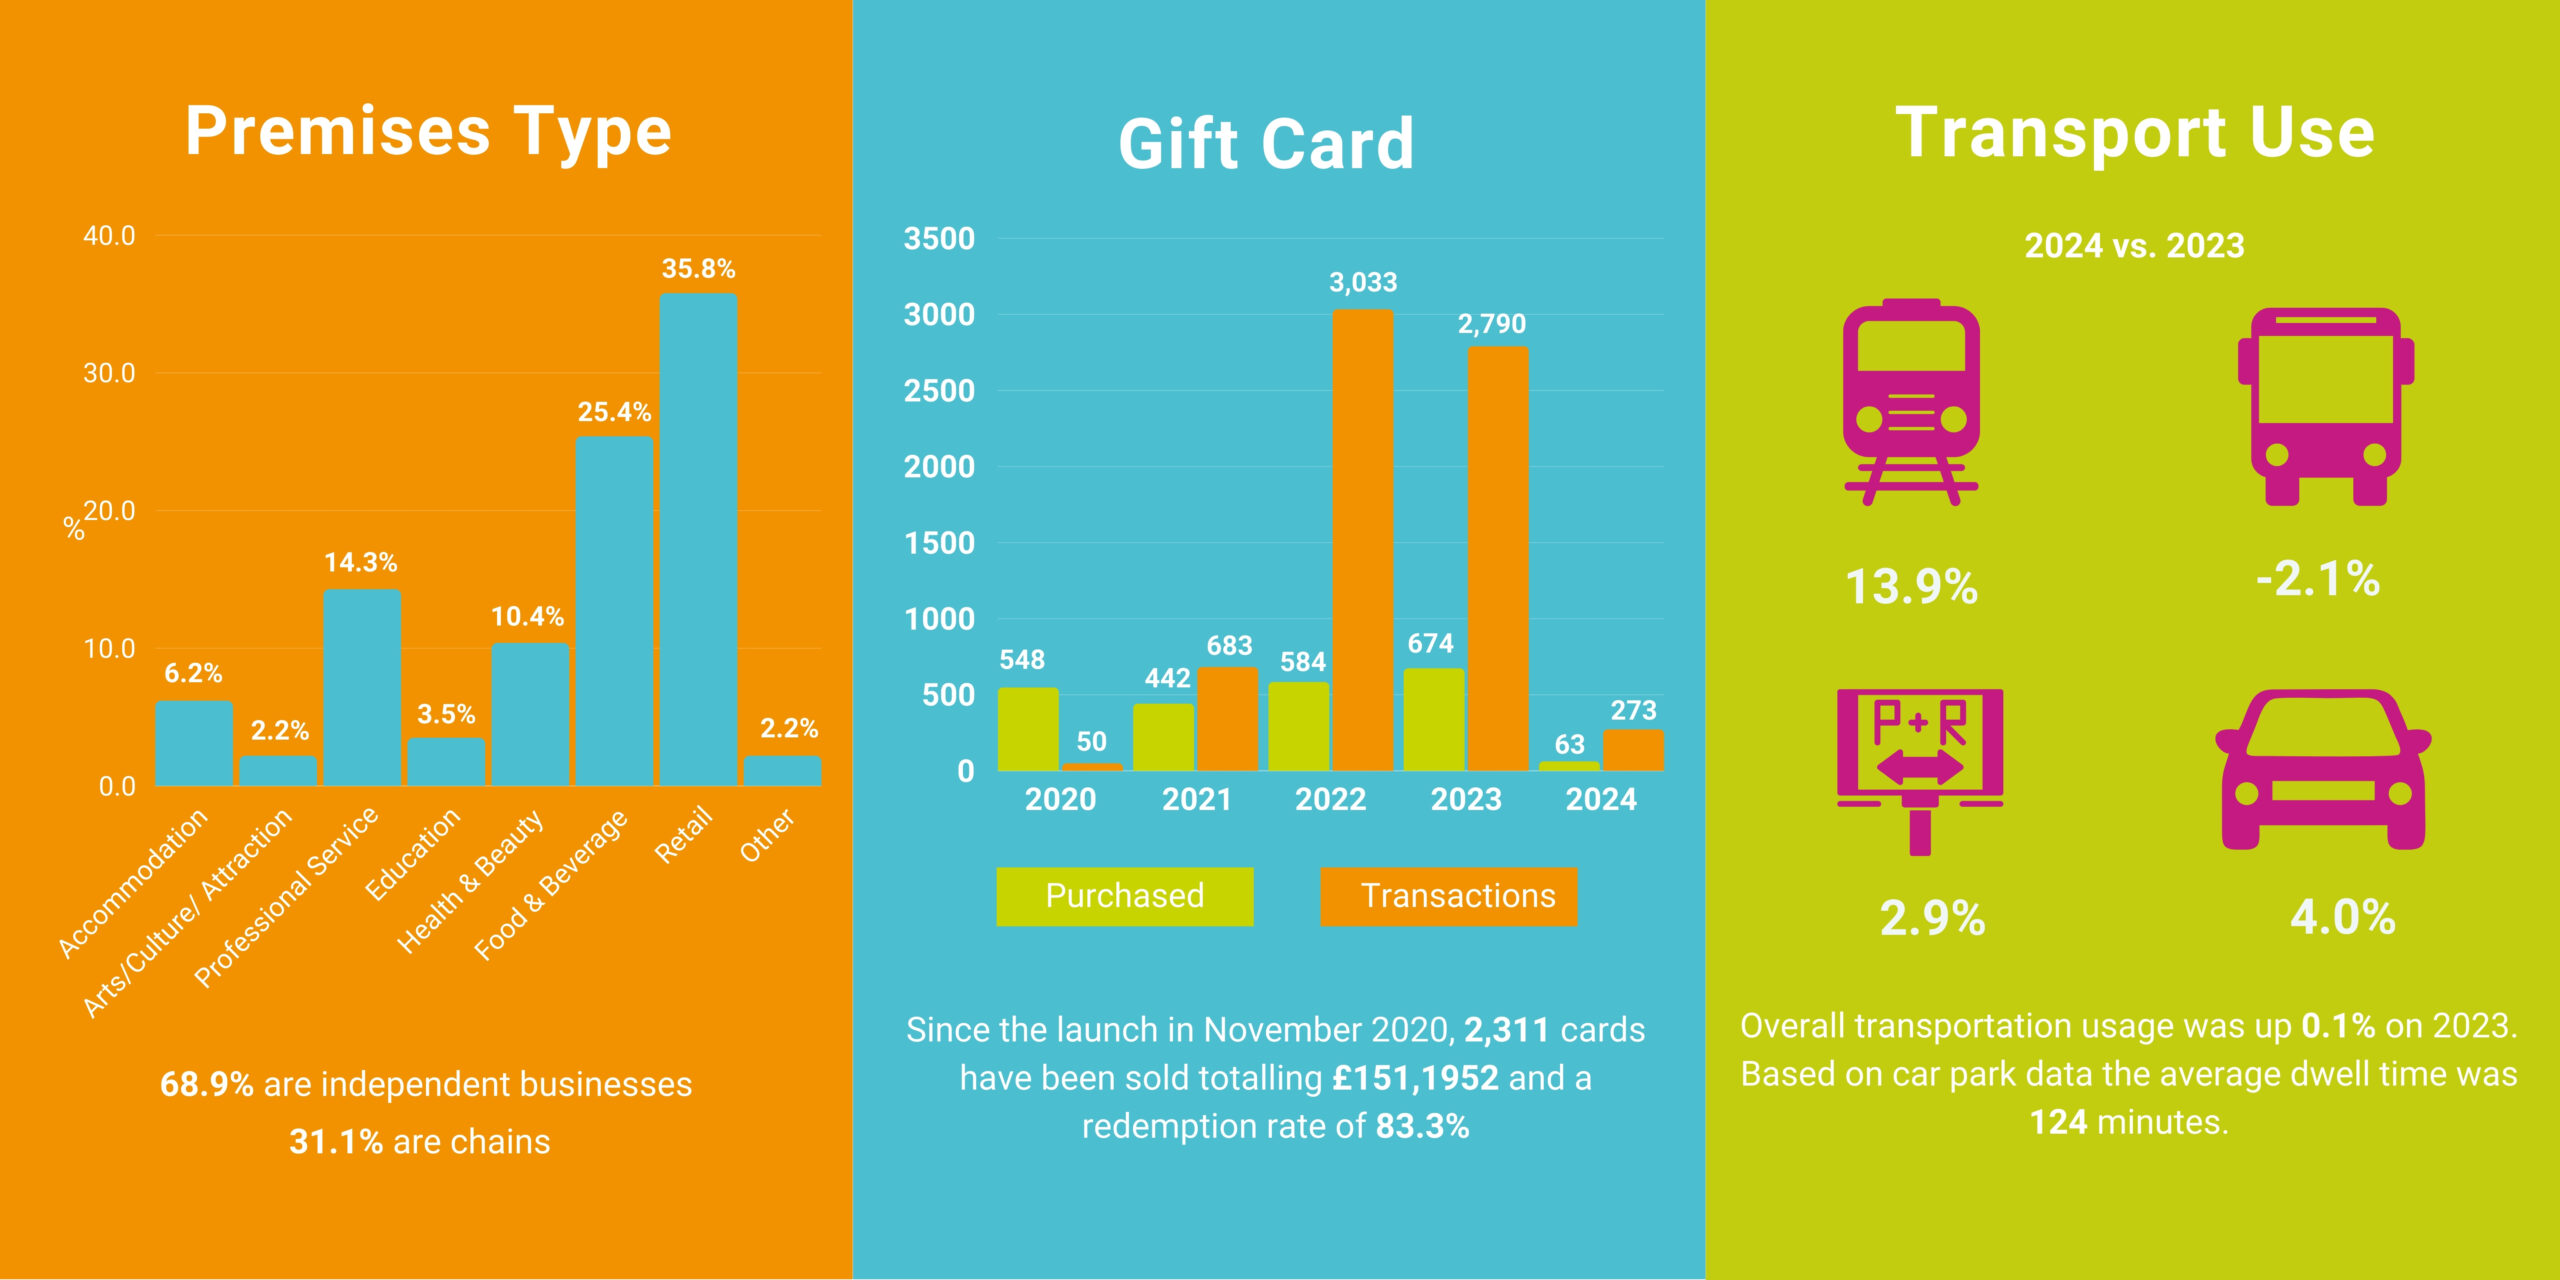
Premises type – An independent retailer is defined as having less than five branches nationally.
Footfall – Data is collected on our behalf by MRI Software to track footfall trends in the city centre.
MRI Software Footfall Reports
Springboards strong coverage on town and city centres nationally, together with its coverage oft he UKs regional cities, means that it is able to provide a robust national and regional benchmark of footfall in towns and city centres. The BID receives weekly and monthly footfall analysis reports through Springboard. A reporting contract was agreed in March 2018 and data has been collected since then. Below you will find the latest weekly reports and a month on month analysis.
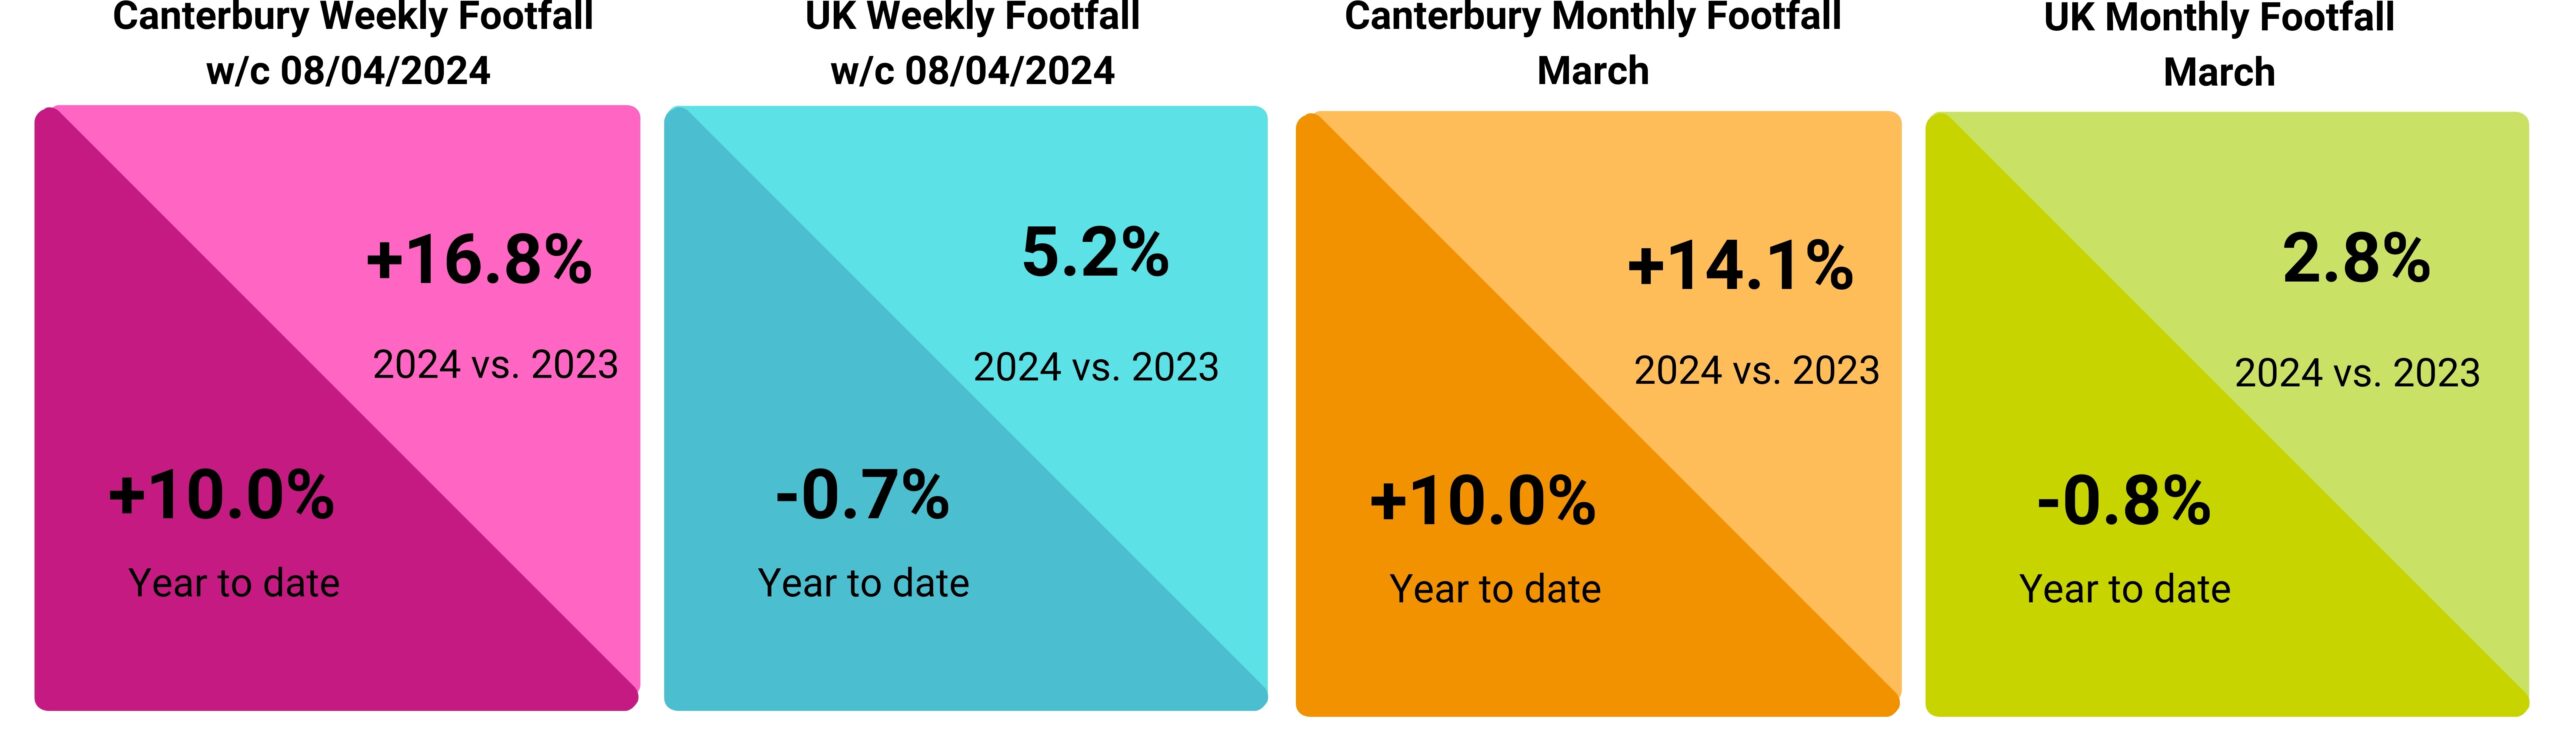
The week numbers are in line with the British Retail Consortium (BRC) calendar and run Monday to Sunday.
Visitor and shopper feedback
On biennial basis Canterbury BID commission Latimer Appleby to conduct on street surveys across the city centre in order to quantify shopper behaviours and satisfaction ratings. Below are the reports from the last six years: